Author Archives: sunil
Creating a Simple JavaScript Chart using CanvasJS
Recently we released a JavaScript Charts library, CanvasJS which is based on HTML5 Canvas Element. Hear am going to talk about creating a very basic chart using CanvasJS. CanvasJS API has been designed from ground up to be intuitive and simple and hence it requires just a few lines of code to create a basic chart. In this article I’ll be creating a Line Chart to explain the basics – but you can change it to any other type by changing the type parameter to column, area, bar, pie, etc.
Basic Line Chart using CanvasJS
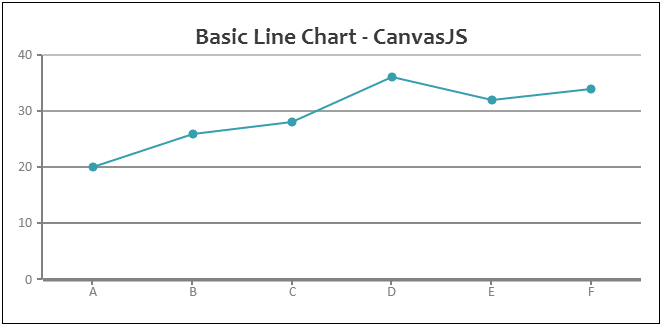
Let us consider following tabular data that needs to be rendered as a line chart.
| Product | Sales |
|---|---|
| A | 20 |
| B | 26 |
| C | 28 |
| D | 36 |
| E | 32 |
| F | 34 |
To start with, you need to create a HTML Container (div, etc) in which to render the Chart and give it an id. This will be passed to the Chart object during its instantiation. Am calling the div element chartContainer.
<div id="chartContainer" style="height: 300px; width: 100%;">
Now that the container is present, lets create a chart object – Chart object resides in CanvasJS namespace. While instantiating the Chart, we pass id of the container element and chart options that contain all the options and data relating to the chart. Below is how the code looks for a complete chart including HTML
<!DOCTYPE HTML>
<html>
<head>
  <script type="text/javascript">
      window.onload = function () {
          var chart = new CanvasJS.Chart("chartContainer", {
              title:{
                  text: "Basic Line Chart - CanvasJS"
             },
              data: [
              {
                  type: "line",//column, bar, pie
                  dataPoints: [
                  { label: "A", y: 20 },
                  { label: "B", y: 26 },
                  { label: "C", y: 28 },
                  { label: "D", y: 36 },
                  { label: "E", y: 32 },
                  { label: "F", y: 34 }
                  ]
              }
              ],
                  theme: "theme1"
          });

          chart.render();
      }

  </script>
  <script type="text/javascript" src="/assets/script/canvasjs.min.js"></script>
</head>
<body>
  <div id="chartContainer" style="height: 300px; width: 100%;">
  </div>
</body>
</html>
Below is how the Chart Looks like. You can paste the above code into the live chart editor present in CanvasJS home page to see it in action.
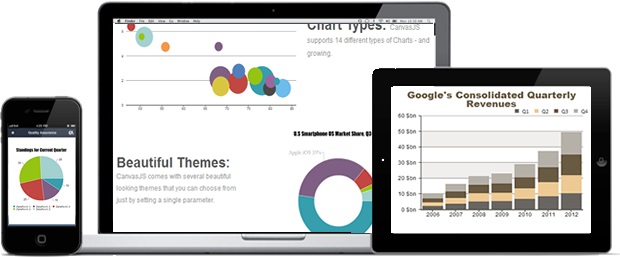
CanvasJS allows you to create over 14 different types of Charts and they are fully customizable. CanvasJS runs on all the devices including Smart Phones, Tablets, Desktops, etc.
You can see more examples from CanvasJS Gallery
Beautiful HTML5 Graphs & Charts – CanvasJS
Today we released an HTML5 Graphing & Charting library called CanvasJS, that works on all modern devices including iPhone, Android, Windows Phone 8, Desktops & Tablets. CanvasJS charts are very simple to use, highly customizable and have a high performance compared to most of the traditional SVG & Flash Based Charts in the market.
Just to give you an idea about performance, most of the SVG and Flash based graphs hit a limit at 10,000 to 20,000 data-points. Whereas, CanvasJS can render 100,000 data-points in just over 100 milliseconds!! You don’t have to take our word for it. You can check out our live demo.

In the current version we are supporting 14 different types of Charts & Graphs including Line Chart, Column Chart, Pie Chart, Bubble Chart, etc. We’ll be adding more soon. You can take a look at our gallery here.
Apart from making the API intuitive, we have also taken a lot of interest in creating an interactive documentation where you can learn and try out the API without having to leave the browser. Best of all you can get started with CanvasJS within minutes!! Here is our getting stared page.
Do let us know your feedback.
Thank you,
Team CanvasJS
Real Time Search on Google with HashPlug
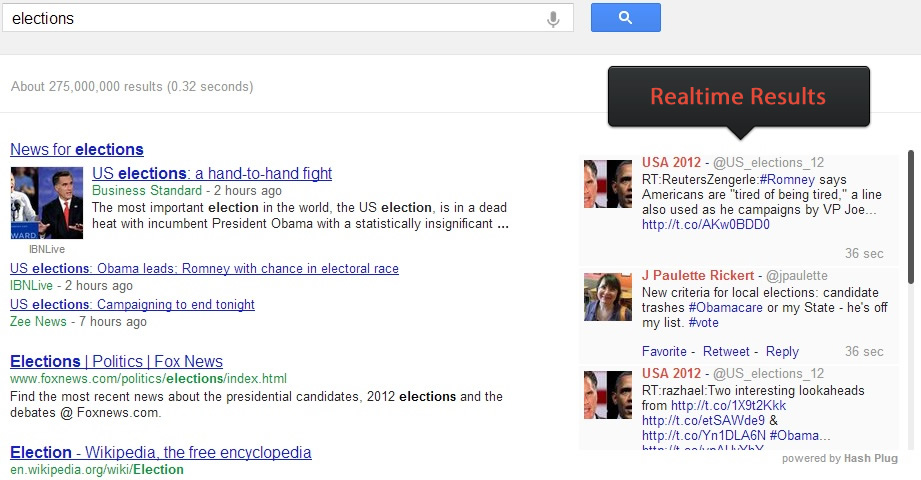
Did you miss real time search over Google? That nice little scroll box which used to update automatically with latest Twitter results? Even we did. So, we thought of creating a Chrome Extension to bring back Real Time Search Results back into Google. You just need to install this Chrome extension and whenever you do a search over Google, it shows relevant twitter results next to Google Results in an unobtrusive manner. For example if you are searching for “elections”, this is how your search page would look like
With HashPlug, you longer have to search for the same term once on Google and once on Twitter. You just search on Google the way you’ve always done and HashPlug takes care of the rest. In the screenshot you can observe that you can see tweets that were just written seconds earlier. As of now it only supports twitter results. But we have plans to integrate Facebook results too in future. Checkout the video below
I had given early beta access to some of my friends and received positive feedback from all of them. Apart from latest trending topics, most of them were also using it for reviews on Movies, Books, Products, etc. Best part is that you can just sit and read tweets/reviews that scroll down one after the other. Do try out the extension and let us know your feedback. Am sure you would love it.
You can install HashPlug from the Chrome WebStore.

