Creating a Simple JavaScript Chart using CanvasJS
Recently we released a JavaScript Charts library, CanvasJS which is based on HTML5 Canvas Element. Hear am going to talk about creating a very basic chart using CanvasJS. CanvasJS API has been designed from ground up to be intuitive and simple and hence it requires just a few lines of code to create a basic chart. In this article I’ll be creating a Line Chart to explain the basics – but you can change it to any other type by changing the type parameter to column, area, bar, pie, etc.
Basic Line Chart using CanvasJS
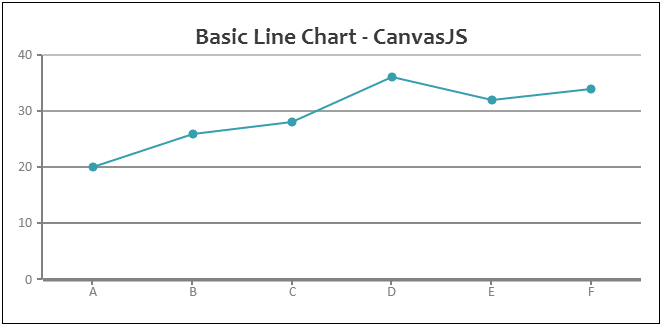
Let us consider following tabular data that needs to be rendered as a line chart.
| Product | Sales |
|---|---|
| A | 20 |
| B | 26 |
| C | 28 |
| D | 36 |
| E | 32 |
| F | 34 |
To start with, you need to create a HTML Container (div, etc) in which to render the Chart and give it an id. This will be passed to the Chart object during its instantiation. Am calling the div element chartContainer.
<div id="chartContainer" style="height: 300px; width: 100%;">
Now that the container is present, lets create a chart object – Chart object resides in CanvasJS namespace. While instantiating the Chart, we pass id of the container element and chart options that contain all the options and data relating to the chart. Below is how the code looks for a complete chart including HTML
<!DOCTYPE HTML>
<html>
<head>
  <script type="text/javascript">
      window.onload = function () {
          var chart = new CanvasJS.Chart("chartContainer", {
              title:{
                  text: "Basic Line Chart - CanvasJS"
             },
              data: [
              {
                  type: "line",//column, bar, pie
                  dataPoints: [
                  { label: "A", y: 20 },
                  { label: "B", y: 26 },
                  { label: "C", y: 28 },
                  { label: "D", y: 36 },
                  { label: "E", y: 32 },
                  { label: "F", y: 34 }
                  ]
              }
              ],
                  theme: "theme1"
          });

          chart.render();
      }

  </script>
  <script type="text/javascript" src="/assets/script/canvasjs.min.js"></script>
</head>
<body>
  <div id="chartContainer" style="height: 300px; width: 100%;">
  </div>
</body>
</html>
Below is how the Chart Looks like. You can paste the above code into the live chart editor present in CanvasJS home page to see it in action.
CanvasJS allows you to create over 14 different types of Charts and they are fully customizable. CanvasJS runs on all the devices including Smart Phones, Tablets, Desktops, etc.
You can see more examples from CanvasJS Gallery

